A tale of Distributed Context
Observability. It's a Buzzword, but critical for understanding failures across a large organisation of distributed services. Context is critical for debugging across team and service boundaries. This is the story of how we came to implement Distributed Tracing to improve our Observability.

I have been excited about Distributed Tracing for a while. It's been on my radar for a couple of years. With OpenTelemetry, maturity is growing every day. I was waiting for an opportunity to implement tracing around a busy roadmap as a software engineer, and my chance finally arrived last year. Here is that story!
What is OpenTelemetry?
OpenTelemetry is a framework for "Observability". Now, Observability is a super loaded term. Essentially, it's about gathering detailed and structured context about your systems for making insights available when you need them most.
The OpenTelemetry project aims to unify three types of telemetry data - Traces, Metrics, and Logs. It provides standards for instrumenting, generating, exporting and ingesting telemetry data. In the long term, this will reduce fragmentation in the ecosystem. I am particularly excited about the reduction in vendor lock-in. Previously, implementations of tracing have ended up highly coupled to vendors. OpenTelemetry will enable observability companies to focus on insights and business value, not re-inventing data formats, instrumentation, and ingestion. I have found that the tracing capabilities are better than metrics and logging for now, but this should improve over time.
Storytime! How have I used it?
I used OpenTelemetry to instrument a system experiencing some unknown issues across two tribes, three squads, and (at least) four services. Firstly, let me set the scene with a bit of background.
Let's first name the squads and their relevant services:
- Product - a Frontend in my Tribe.
- My Squad - Cross-product Backend APIs for my Tribe.
- Account - Cross-product OAuth and Legacy Account APIs.
My squad enables product squads in Gaming to focus on what they do best - building a great product. Ditto, for the Account squad.
Our backend service facilitates Legacy->OAuth session transfer and performs OAuth Tokenset cookie maintenance on all requests through HTTP middleware. Our Backend squad was essentially abstracting the Account API calls and maintenance of OAuth sessions to simplify complex Account integrations across multiple Product frontends.

What was the problem?
On login, the Frontend creates two sessions - a "Legacy" and an "OAuth" session. For a small number of customers, the Product squad found that the OAuth TokenSet was not present in cookies leading to some requests failing with unauthorized errors. They expected a valid OAuth Tokenset to be present in cookies from their previous call during login for Legacy-> OAuth session transfer. Despite the session transfer failing, the Frontend "login flow" as a whole was still successful because the Legacy authorization was. The failures meant that some newer features depending on the additional OAuth session were failing. Naturally, the Product squad asked us to help.
Investigation time
As the Product squads integration point, we investigated. We could see from our logs that many of the failures were to do with accounts lacking authorization. We told the Product squad that they were unauthorized requests. "How is that possible?" they asked. Neither squad understood. They insisted it must be for another reason because all API calls were from accounts with a valid Legacy login session.
We took their word for it and investigated any remaining errors with the session transfer. I improved our logging to include the full context of errors in a single structured log rather than multiple log lines per request. I then set up a Kibana dashboard to sum API call failures by the error message (we use the Elastic stack for log shipping). Using the summary, we could show that, yes, there were still network issues. However, we still insisted to the Product squad that the primary reason for these requests failing was that the customer was unauthorized. "How is that possible?" they asked. "The customer is already logged in!".
We took their word for it and began to investigate the network issues. We noticed spikes of timeouts on Kibana graphs. We weren't exactly sure where this was timing out. It could have been in a few places. Our backend lives in AWS ECS. It makes requests to the Account APIs which are not in AWS - instead hosted in an on-premises data centre (for compliance). These requests go over the internet (fronted by Akamai) or over a Transit VPC to get to the on-premises data centre. From there, it's through a web-tier ZXTM load balancer, an app-tier F5 load balancer, then onto the applications. The applications themselves are either on a VMware stack or an on-premises Kubernetes cluster requiring routing through the overlay network and the Istio envoys. Quite a few places for failure - and that's just describing the ingress to the app tier!
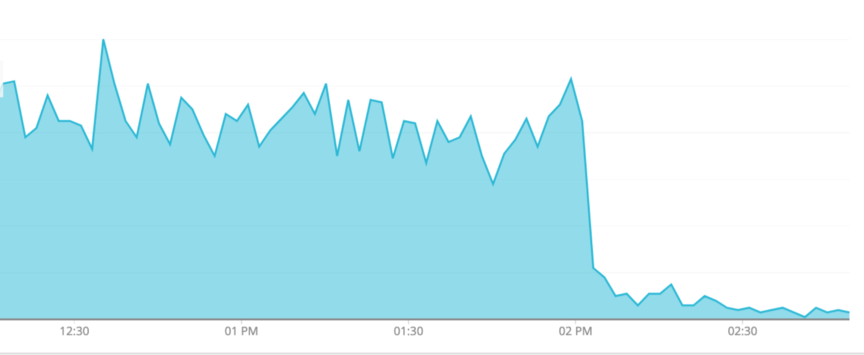
We asked the Account squad if they could see these spikes on their end. They could! We were making some progress - at least our request was getting that far. Excitedly, they worked on fixing the issues. It was DNS. It's always DNS! There were sporadic issues with CoreDNS availability in the Kubernetes cluster. Their backing services were timing out on DNS lookups. With the addition of some DNS lookup retries, the spikes subsided.
So we had made some excellent progress! However, the Product squad was still reporting issues. The errors were an even higher percentage of authorization failures now, which backed up the theory of unauthorized users. The Product squad could see that the DNS retry fix had reduced the rate of failures but certainly not eliminated them. We asked the Product squad how some users might not be authorized. "How is that possible?" they asked. "The customers are logged in!", "They have a legacy session!".
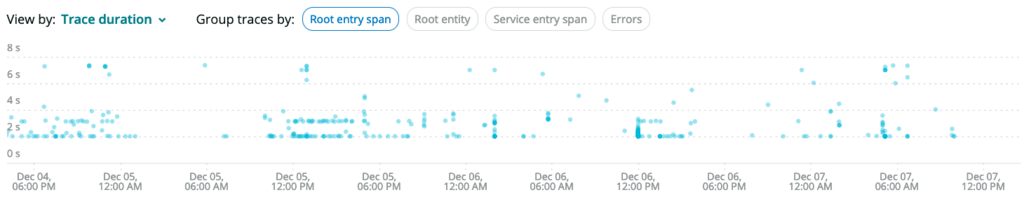
We dug a bit deeper. There were still some network issues, albeit at a lower rate. We decided that Distributed Tracing would be insightful. Passing around timestamps so we could each check our respective logging and monitoring tooling for context was getting tiring. A shared view of our requests would be better. We now had a good justification for putting in some time to improve our observability.
Implementing Distributed Tracing
It turns out NewRelic is in use around the business, including the three other services. Very convenient! NewRelic has a suite of products for monitoring applications which we use. Firstly we use the frontend monitoring capabilities. Additionally, some services use their APM agents for backend monitoring. However, I prefer to not couple monitoring to proprietary systems. Fortunately, the business as a whole does not rely on NewRelic for monitoring, with Prometheus with Grafana used for most services. Tracing, however, was lacking. The Account services had NewRelic APM agents with Distributed Tracing enabled, which works for their services. However, our Go applications did not have any Tracing capabilities. There did not seem to be consistent adoption of open standards in use in the business either. If only all services were inside one large service mesh with some automatic instrumentation!
I discovered that NewRelic APM agents support the W3C Trace Context specification. This standard defines how Trace Context data is persisted throughout the request-response cycle as it propagates from service to service. W3C is also the default Propagator for OpenTelemetry. This default and the support by NewRelic enables their APM agents to Propagate headers between any other OpenTelemetry service. I was super excited about this because I can now ensure compatibility with other systems.
Instrumentation was easy too! There are instrumentation packages for the HTTP server, request routers, and HTTP clients. For the HTTP clients, httptrace generates spans about DNS lookups, connection establishment, TLS handshakes, and receiving the response. That detail is invaluable for diagnosing network issues. I also found it easy to add custom attributes data to the spans generated by the automatic instrumentation. That's excellent for adding details about any custom business logic that can not get annotated automatically.
We also integrated the NewRelic OpenTelemetry Exporter to ship off the trace data using their ingestion API. Note for future integrations: you can now use an OLTP exporter enabling NewRelic ingestion in a standards-compliant way too.
A further promising benefit of OpenTelemetry is that we are less locked in with any particular vendor such as NewRelic. If we decide to use another trace aggregation service, we can do. Swapping out the exporter is all that is needed. That is even simpler with OLTP when it's just swapping out the endpoint. Multiple exporters could even integrate simultaneously! That could be Honeycomb, Lightstep, Elastic APM, etc. Providers can now compete on their ingestion and aggregation capabilities instead of their ease of integration. Secondly, as the OpenTelemetry ecosystem matures, we may get other benefits "for free". One example might be replacing our custom Prometheus instrumentation with OpenTelemetry metrics exposed on the metrics endpoint or ingested by Prometheus via the push gateway.
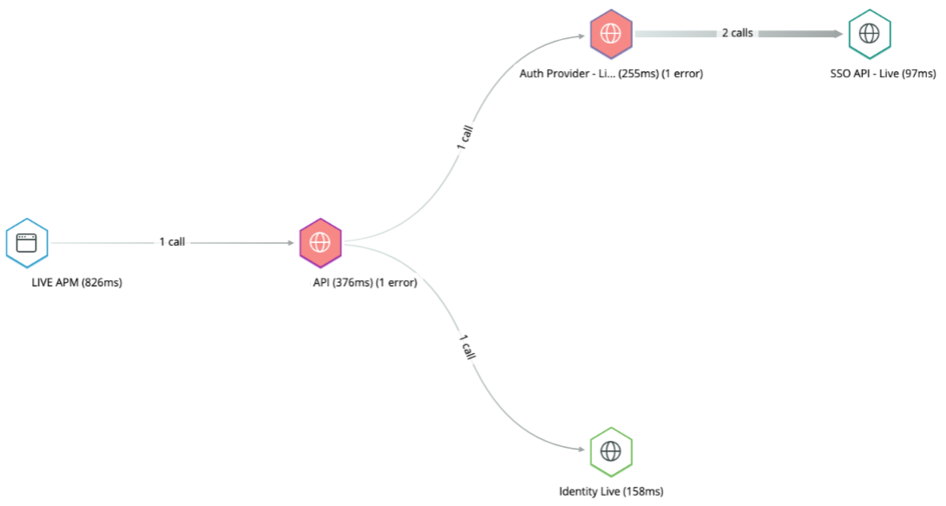
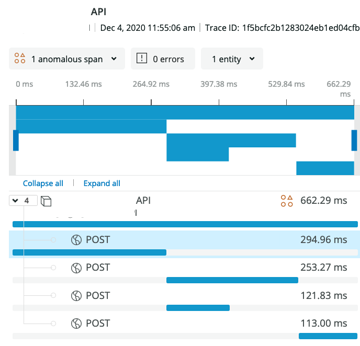
So now we had Tracing data for our service in NewRelic - awesome! We asked the Product squad to enable Distributed Tracing on their browser agents too. Once they did this, we had distributed tracing with data from four services across squad, service and tribe boundaries. It was satisfying as this was a first for the business.
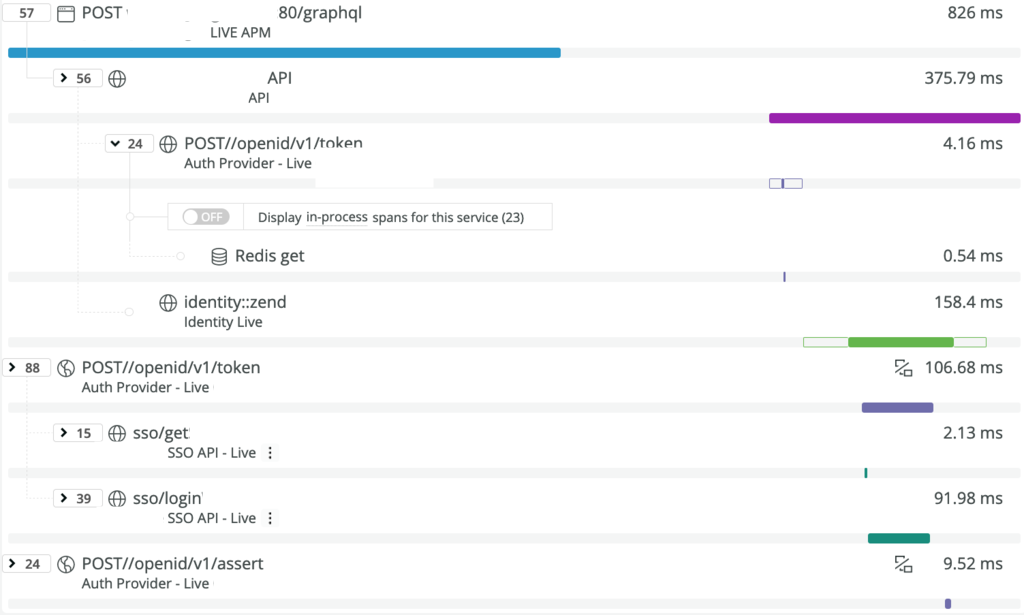
We also added httptrace instrumentation which helped us to find further details about some outlier network request failures. We tweaked our Go HTTP client configuration to increase timeouts which reduced the network failures. Now, the network failures were as good as zero compared with the unauthorized users. We told the Product squad that the users are not authorized. "That can't be!" they said. "They're logged in to Legacy!".
This time, we had essentially resolved the network issues. We recorded the error message in a custom attribute on our spans in the distributed trace. The Product squad could now see for themselves, with the full context in their view of NewRelic, that unauthorized users were the cause of most failures.
Product investigated with the Account squad and discovered an issue with the login flow. It turned out that suspended customers were getting a Legacy session but not authorization for the minimum scopes required for issuing an OAuth TokenSet during the session transfer. It made absolute sense that they could not perform these actions. An additional user journey for suspended customers resolved the remaining errors.
Summary
Did implementing the Tracing fix our issue? Not exactly. The problem was more in our understanding of the integration prerequisites than the operational interactions between these systems. The main issue was still visible in the logs. However, we did find issues that would have contributed. That said, Tracing gave our squads a shared understanding of the nature of our complex distributed requests and how they can fail. It helped to discover, quantify, and put in context the multiple issues we were experiencing. We eventually narrowed down the root issue, improving our reliability in the process. In the future, with tracing in place, we will be able to drill down to these answers much faster.